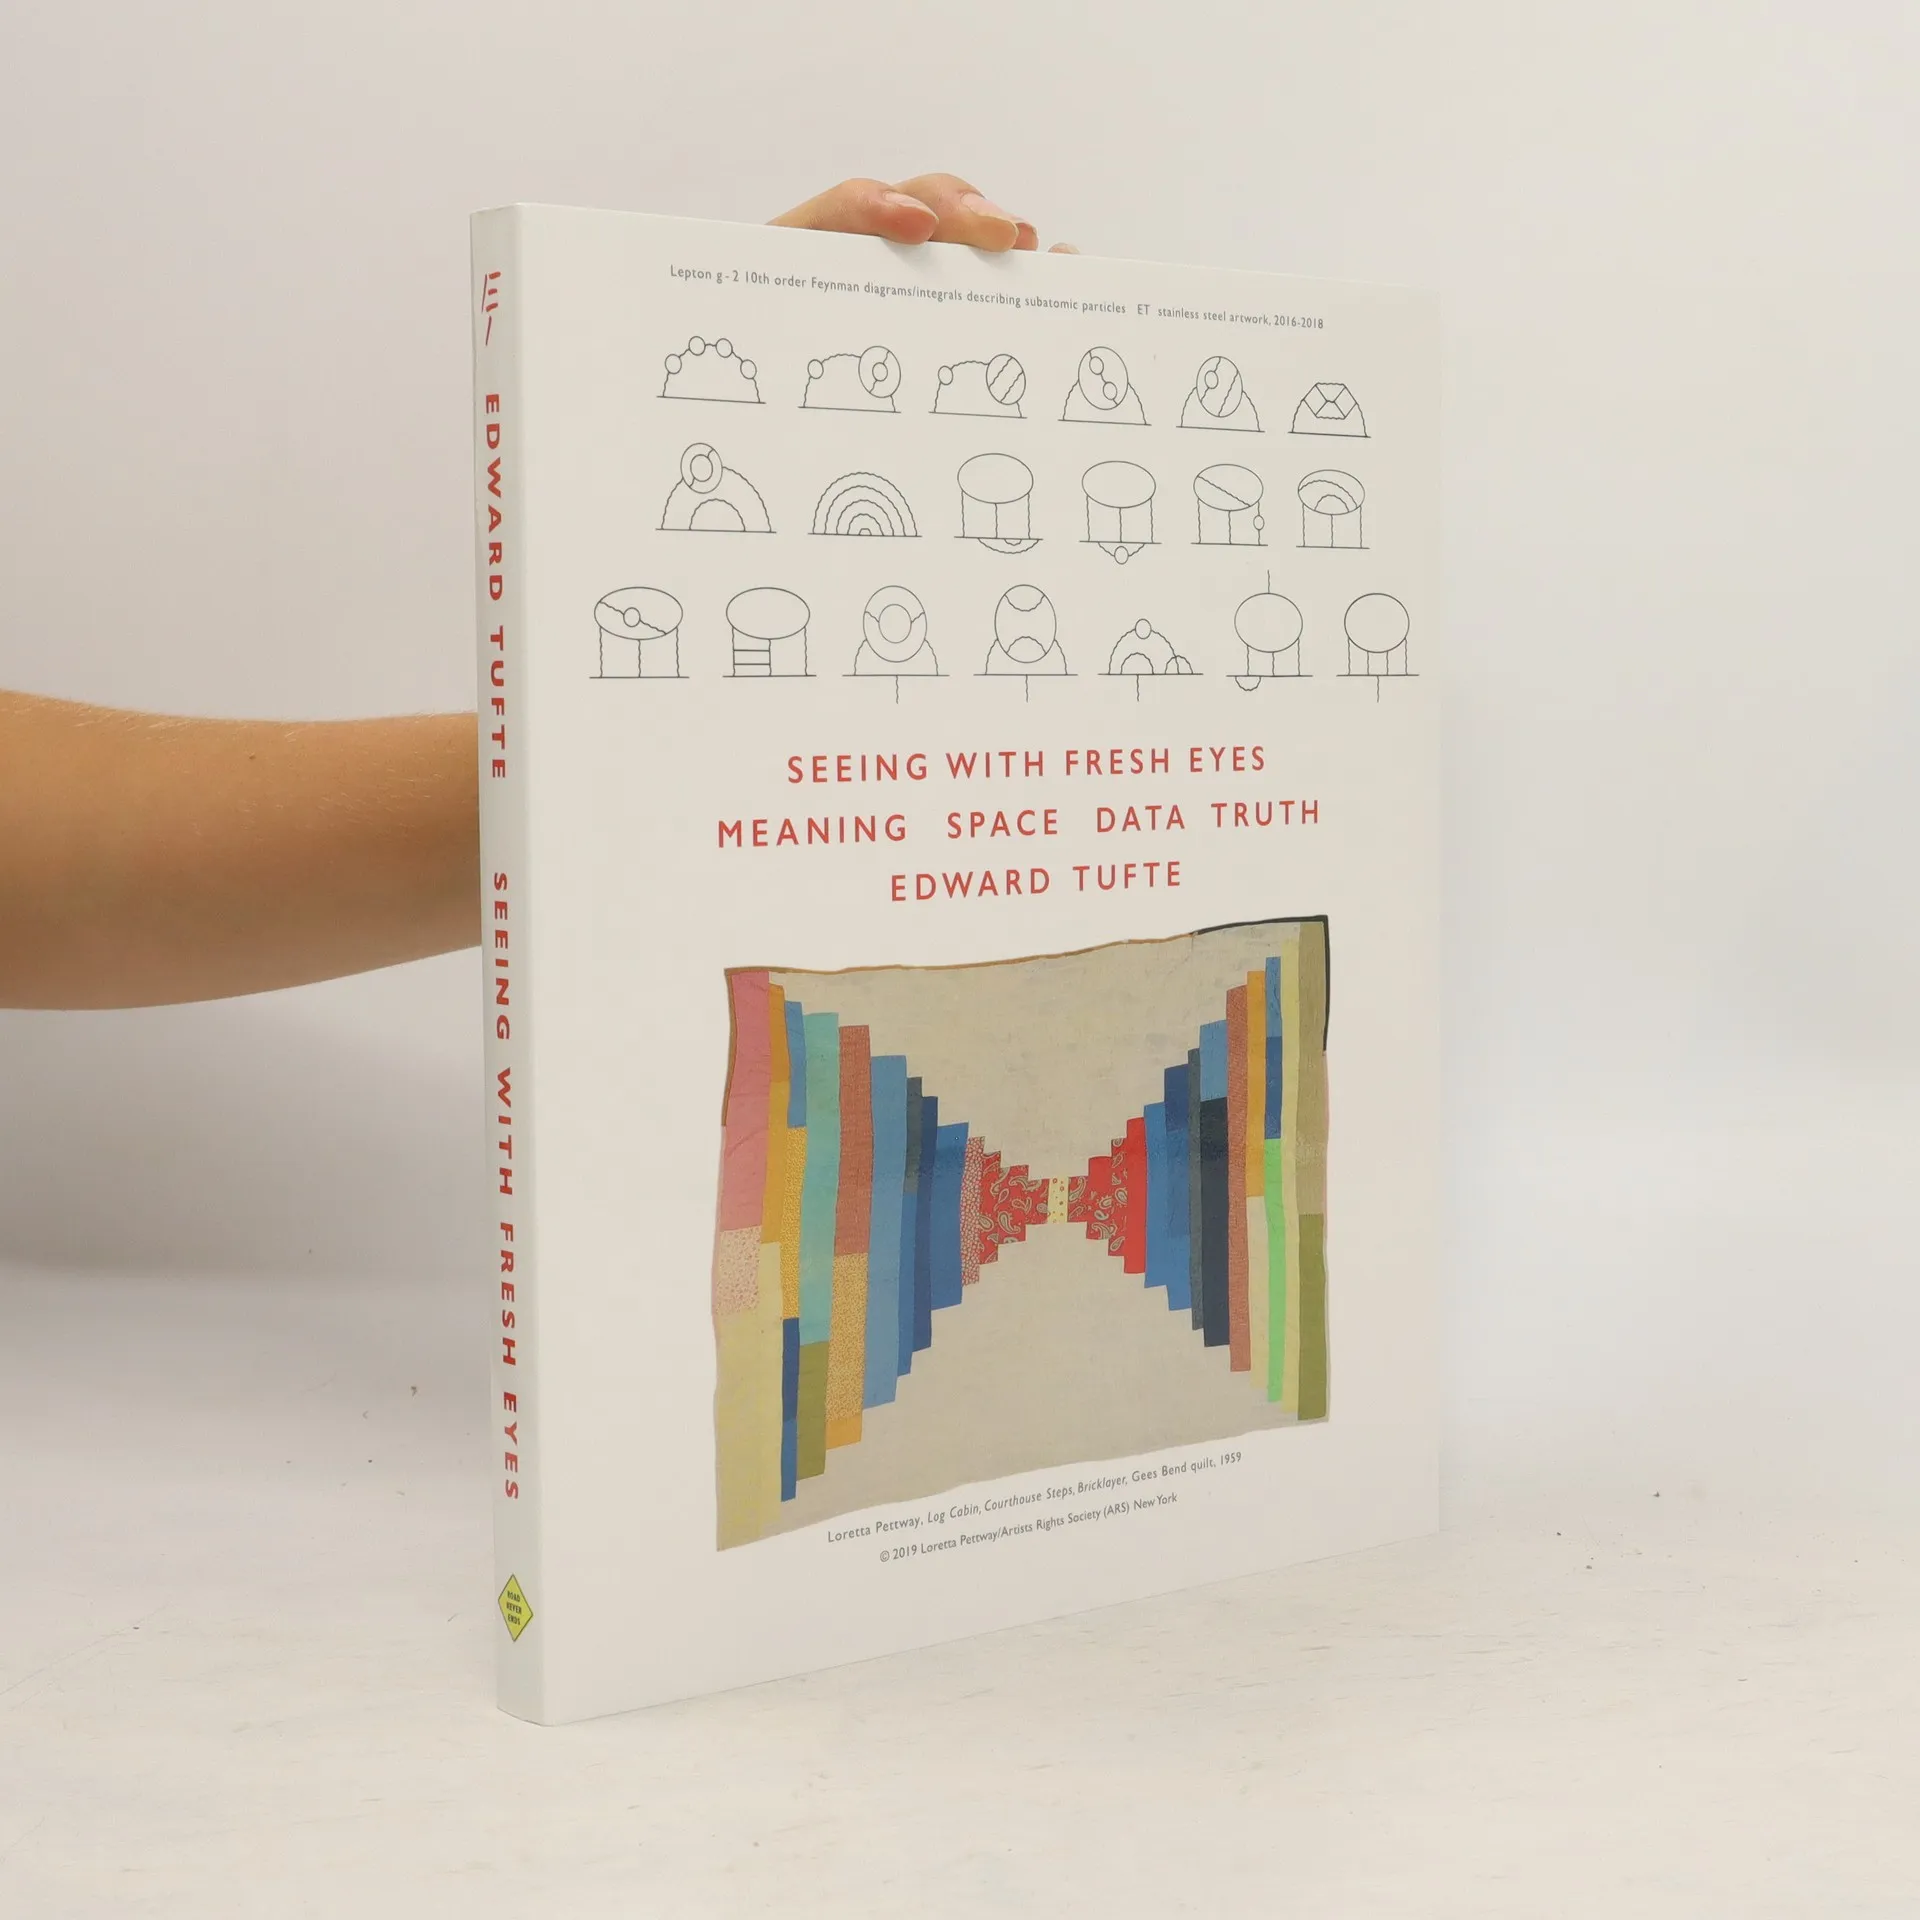
Edward Tufte est un expert renommé en visualisation de données, dont le travail se concentre sur la présentation claire et efficace d'informations complexes. Son approche des graphiques d'information, tels que les tableaux et les diagrammes, lui a valu d'être reconnu comme le 'Léonard de Vinci des Données'.
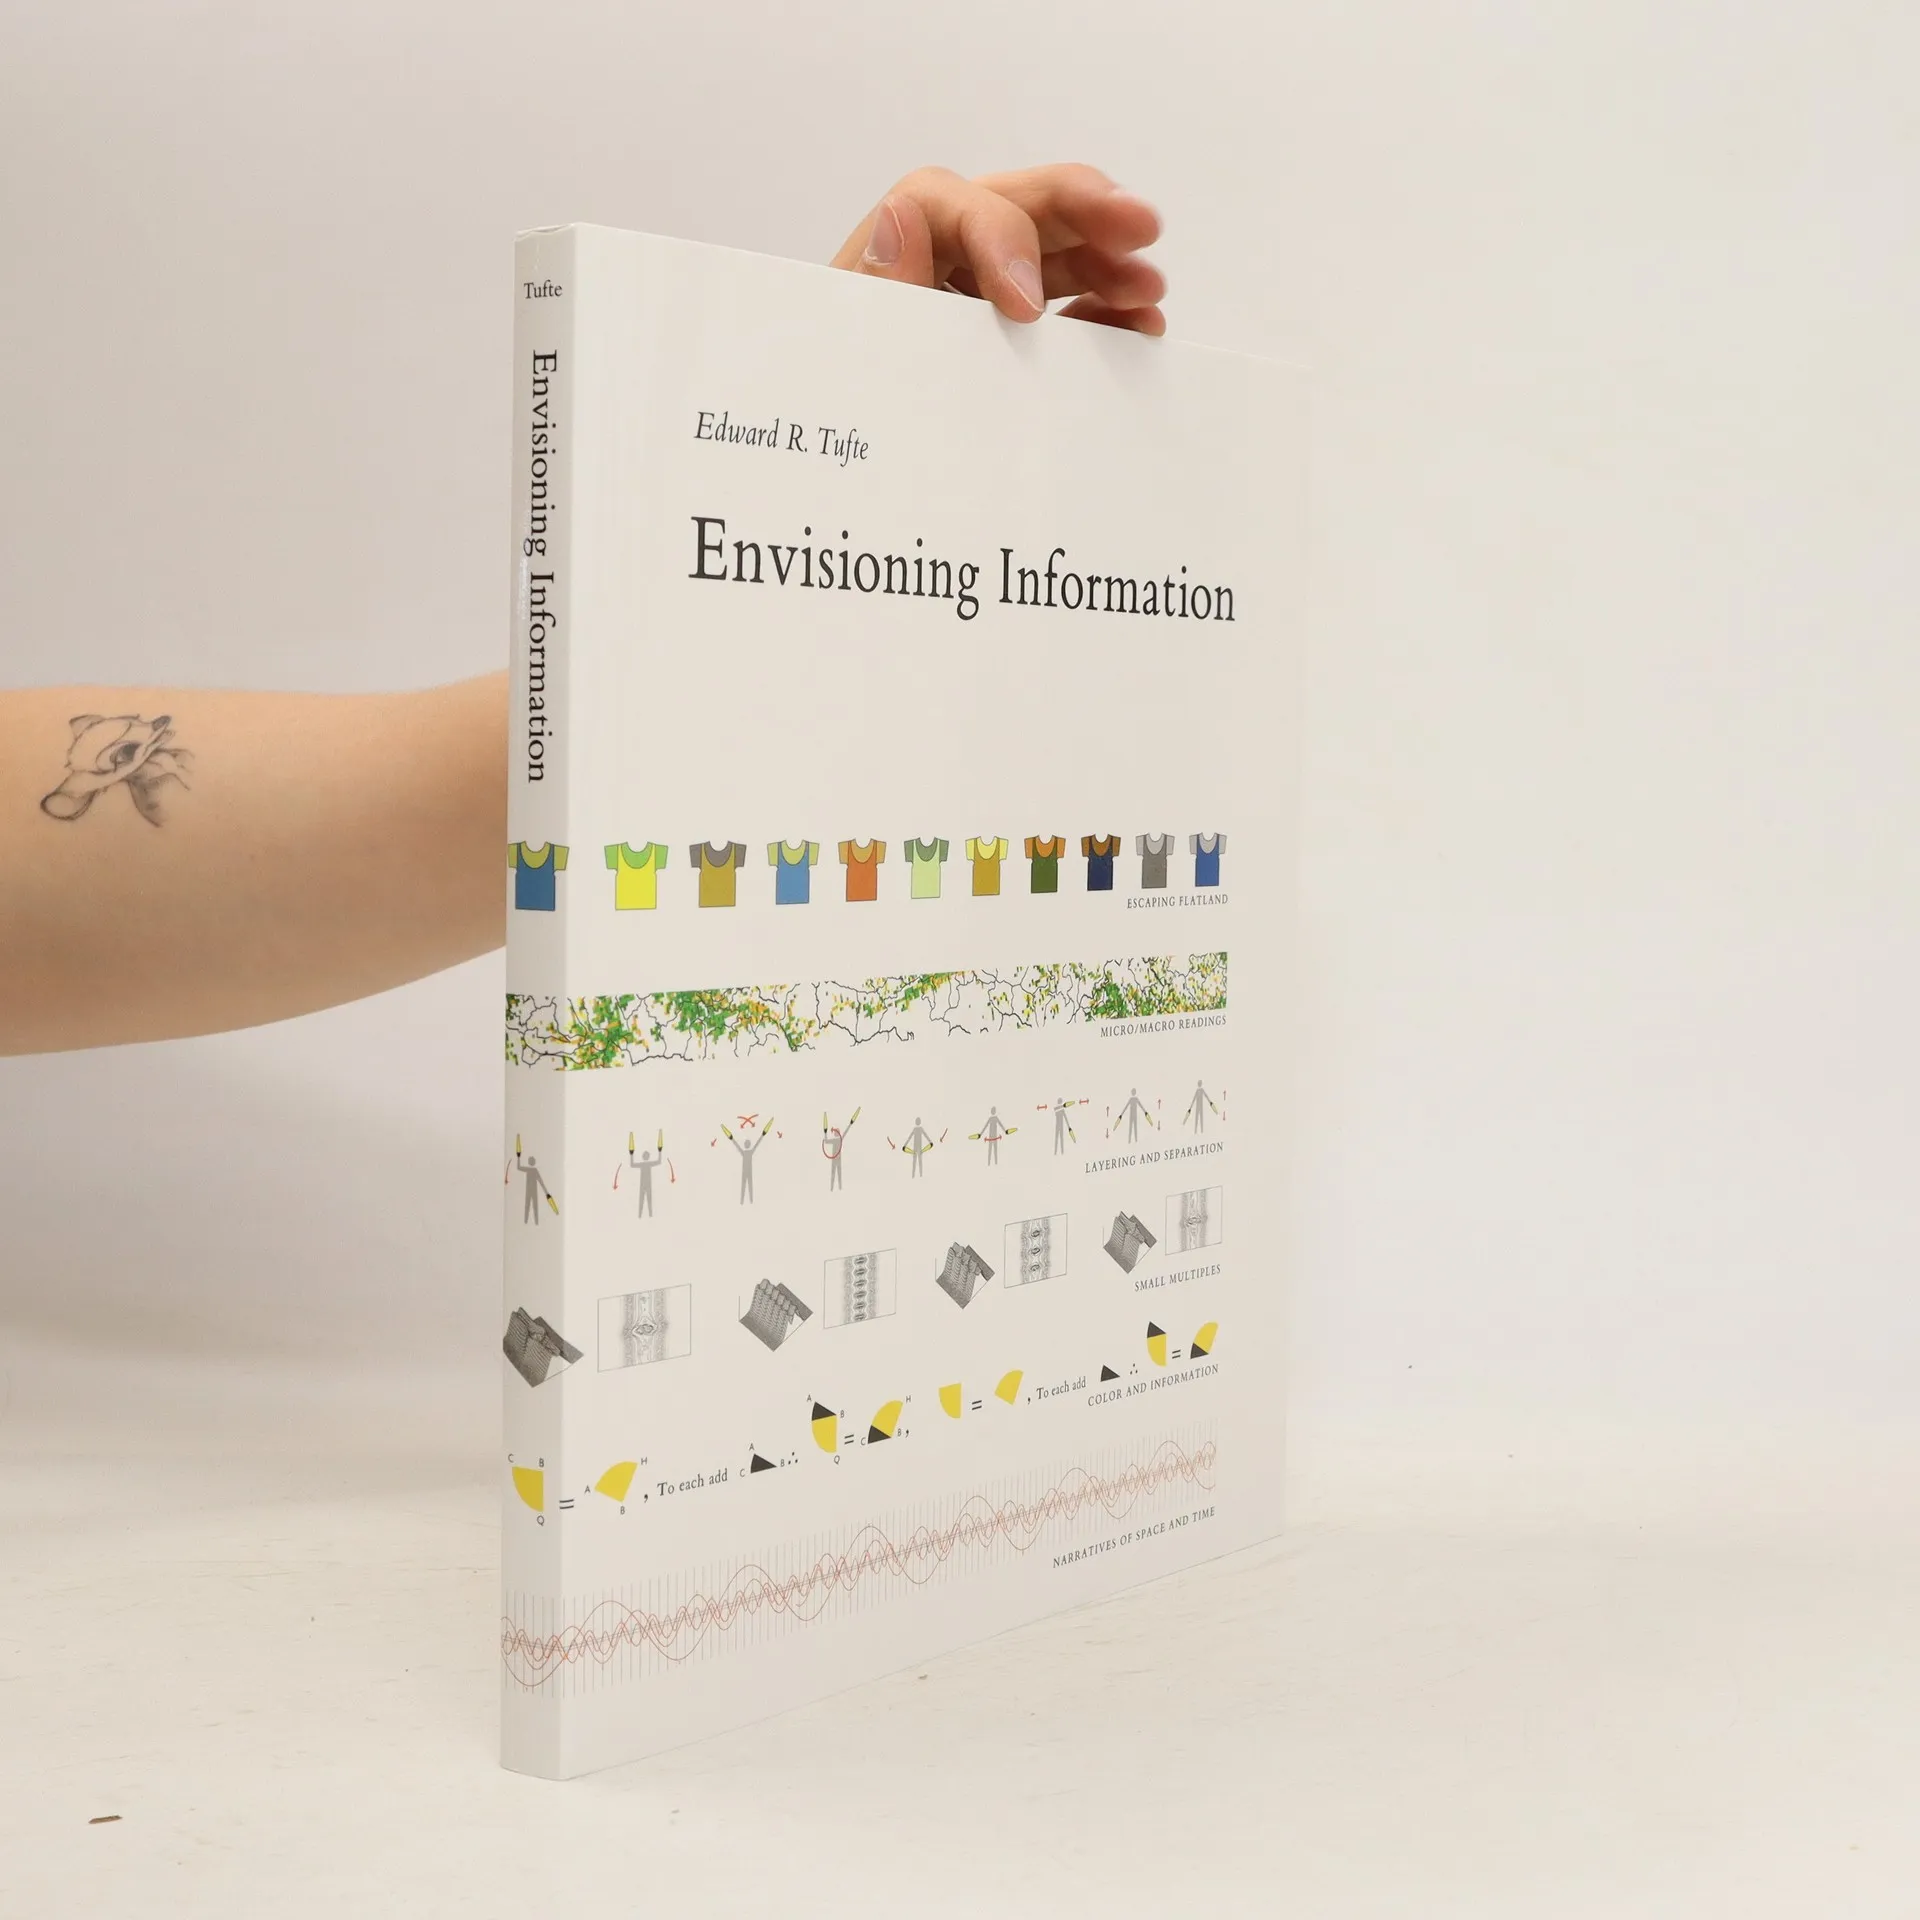
A modern classic. Tufte teaches the fundamentals of graphics, charts, maps and tables. "A visual Strunk and White" (The Boston Globe). Includes 250 delightfullly entertaining illustrations, all beautifully printed
Display of information for paper and computer screens; principles of information design, design of presentations. Depicting evidence relevant to cause and effect, decision making. Scientific visualization.
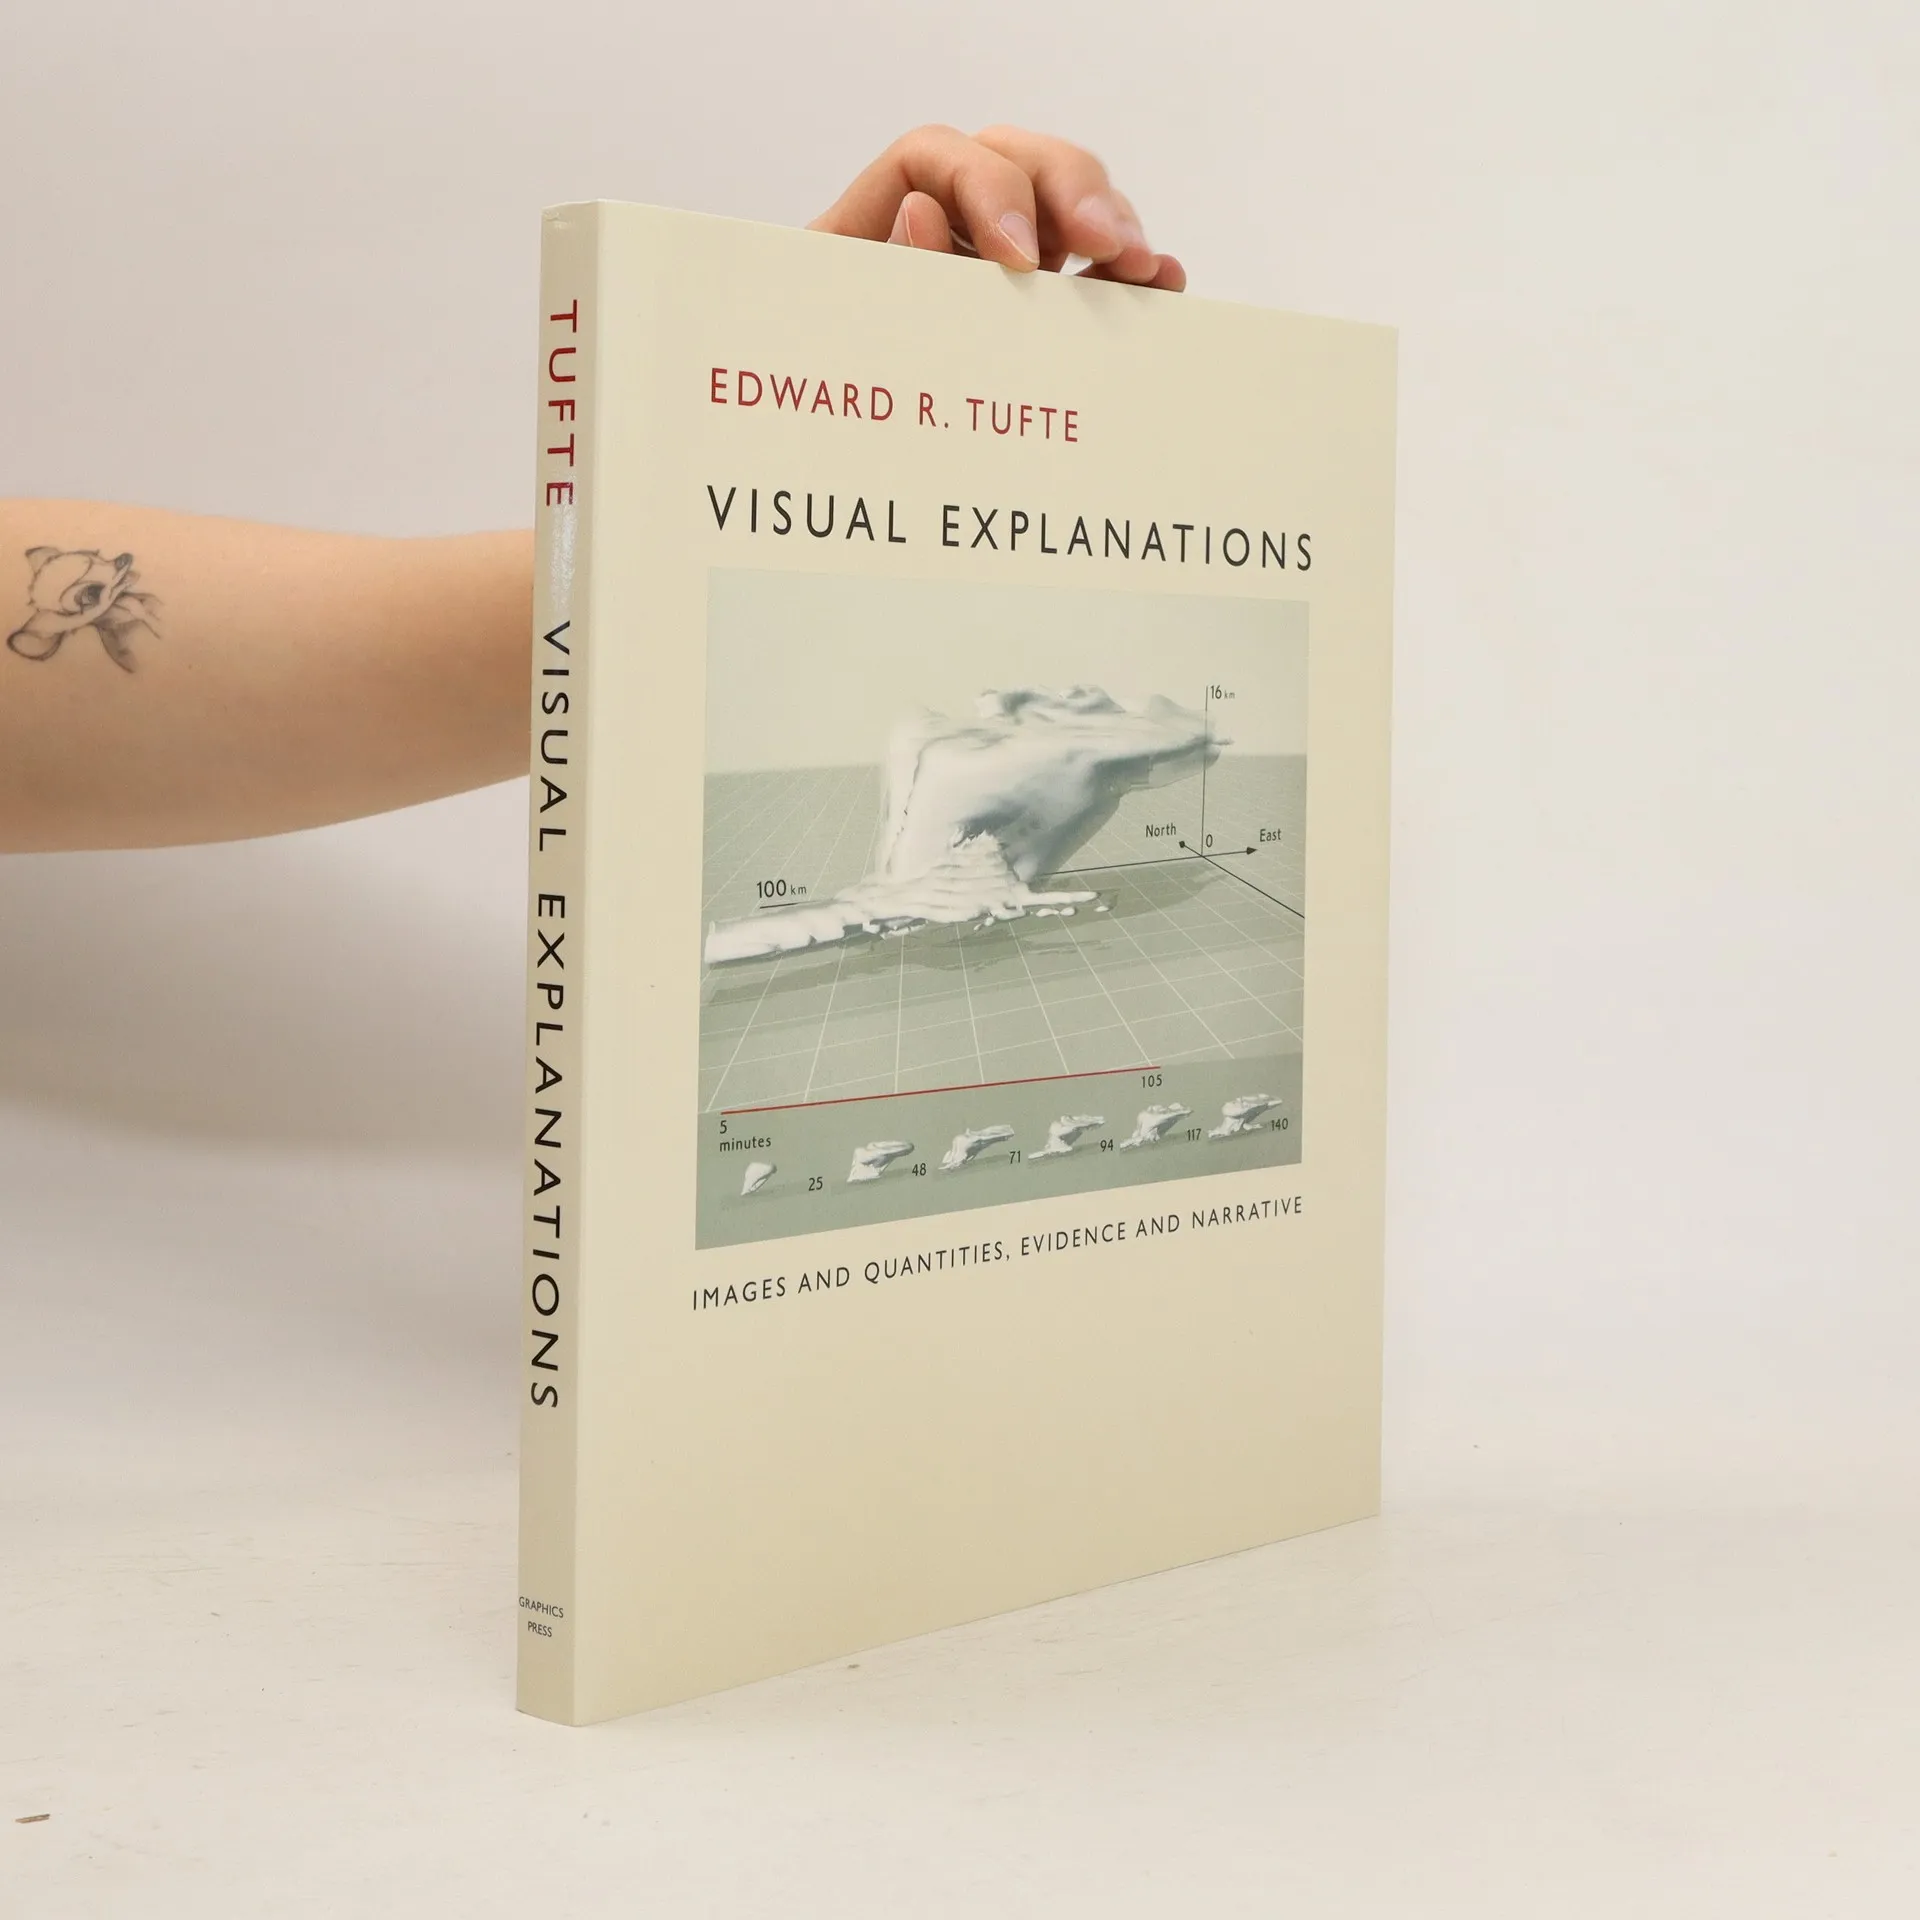
Provides practical advice about how to explain complex material by visual means, uses extraordinary examples to illustrate the fundamental principles of information display.
The Thinking Eye 4. 1 Meaning And See With Fresh Eyes, Question Everything, Remodel Conventional Models 6. 2 Content-Responsive Typography, Redesigning Sentences, Paragraphs, Labels 49. 3 Graphical Nouns And Verbs, Structure And Function 64. 4 Data Analysis When Truth On The Relationship Between Evidence And Conclusions. Remodeling Statistical Practice And Teaching 81. 5 Explanatory Words, Numbers, Graphics, Images, Organized By Content-Responsive Local Grids. Is Thinking Just Annotating The World? 121. 6 Instructions At Point Of Need 131. 7 Theory And Practice 141. 8 Smarter And Shorter Remodeling Nonfiction Presentations 150. 9 A Visual Index, A Quilt Of Sources And Remodeling The Back-Matter In Books 162.